AI in Excel Sheets: How to Use AI in Excel Sheets?
Integration of AI in Excel sheets has elevated the tool to new heights of efficiency. AI has transformed Excel’s data manipulation with task automation, predictive analysis, and better data visualization. Read if you want to become a power user and harness the maximum potential of AI in Excel.

Do you dread remembering complex Excel formulas? Does the job of entering large datasets manually onto Excel sheets haunt you? Well, Worry not. Integration of the AI in Excel sheets has solved your problem. Artificial intelligence features of the Excel tool have automated many tasks that require human labor.
Microsoft Excel is deemed one of the most reliable spreadsheet tools. 63% of companies view it as essential accounting software.AI technologies in business tools have optimized business processes. Seeing the advancements that AI has brought in, it feels like we are living in 2050 already.
Talking about Excel, Artificial intelligence has transformed its conventional data handling. AI in Excel sheets has enabled both task automation and predictive data analysis.
So, if you struggle with managing complex data in Excel, you have landed right. Our step-by-step guide explains every AI feature that the Excel tool offers. Read if you want to be a pro user and save yourself some extra working hours.

Using AI in Excel Sheets: A Detailed Guide
The AI in Excel has eased the user's lives by increasing spreadsheet productivity.
Following is the list of AI tools in Excel that you can exploit to save both time and labor.
Analyze Data: AI Insights Tool in Excel Sheet
This AI feature in Excel sheets enables you to analyze complex data efficiently. The Analyze Data tool lets the users ask questions about data in simple words. It also yields visual trends and patterns to simplify and summarize data. Thus, it saves you from writing complex formulas and codes.

Moreover, the AI tool provides valuable suggestions based on the data and helps you in decision-making. Follow the guide below to use the Analyze Data AI tool in Excel sheets.
Step 1: Open the MS Excel application.
Step 2: Open up your data. Alternatively, you can copy-paste a sample Excel data if you are practicing.
Step 3: Next, Click on the Analyze data in the home tab on the ribbon.

Step 4: After that, a new pane opens up the right side of the Window. Here, you can ask the questions about your data. If unsure what to ask, the AI in Excel sheets will suggest questions based on the data.
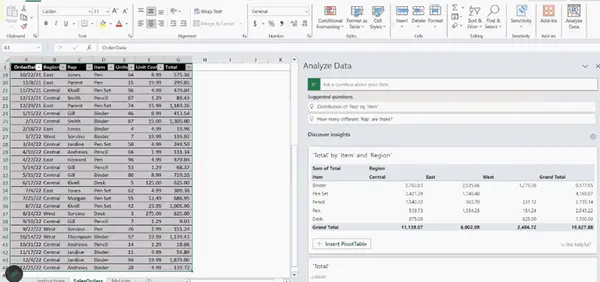
Step 5: Type in your question in the text box. For example, you can ask about the percentage of total unit cost for each item.
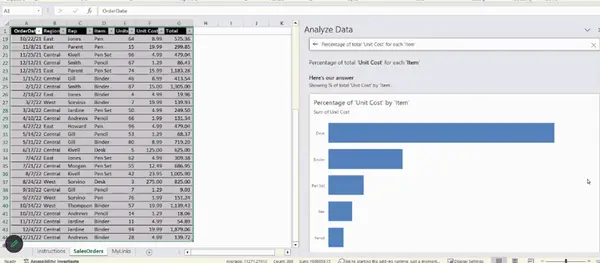
Step 6: Press the Enter.
Step 7: As a result of your questions, Excel's AI will generate charts and pivot tables
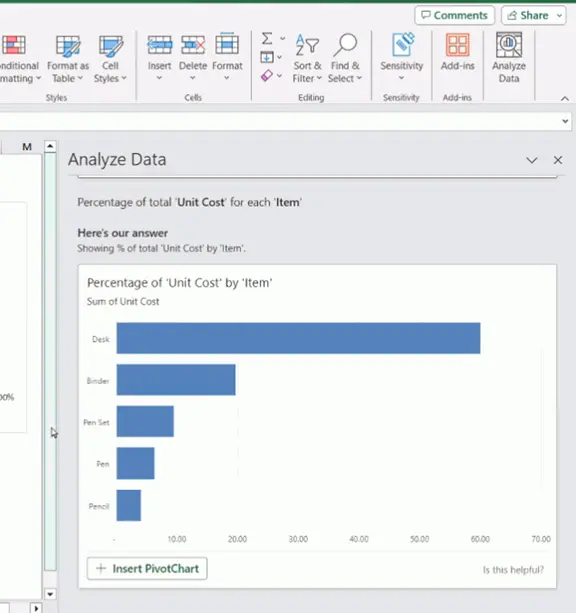
Apart from that, you can visualize more results at the bottom.
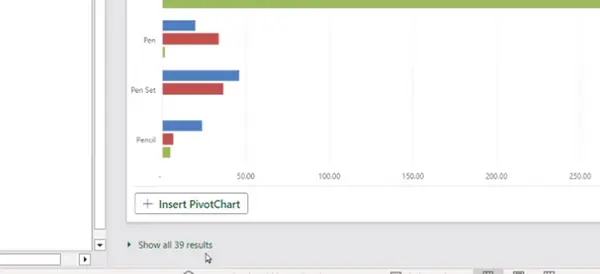
Step 8: Insert any chart or table in your Excel sheet.
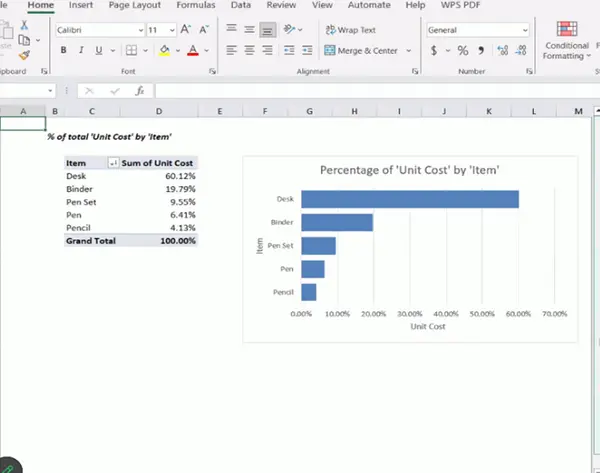
Step 9: Lastly, if the results are unsatisfactory, you can adjust the parameters in the setting. Then, produce new results for a better understanding of the data sets.
Data from Picture: AI Feature in Excel Sheet for Data Entry
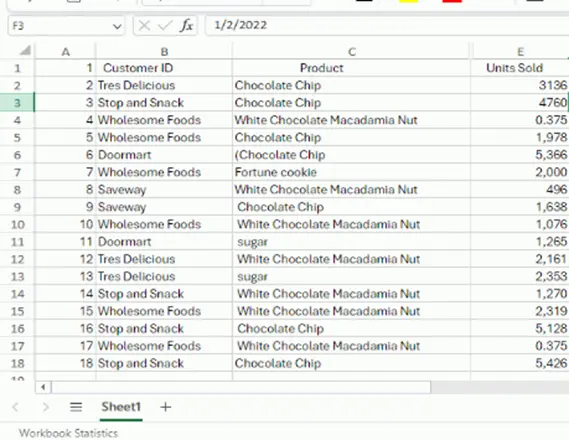
You all might know how to add images to an Excel sheet. But now, with the AI in Excel, you can also turn an image into data. The tiresome days of manually entering data from the hard copies have ended. This process is both time-consuming and susceptible to error. Even the tiniest mistake can seriously affect professional documents.
However, AI in Excel has changed the game. Now, you upload the picture of the data, and the AI will convert it into an editable Excel spreadsheet.
Following are the steps to do that.
Step 1: Take an image of your data and save it on your device.
Step 2: Open the Excel app. Click on the Data tab.
Step 3: Then, Select the Data From Picture option.
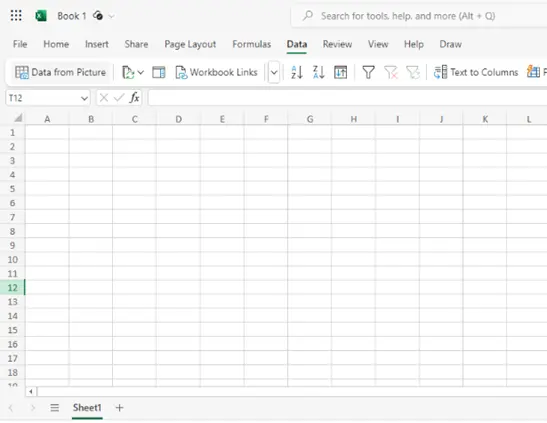
Step 4: Browse the location of your saved image and upload it into Excel.
Step 5: AI in Excel sheets will take time to analyze the data. After a bit, you will see two options.
- Review
- Insert Data
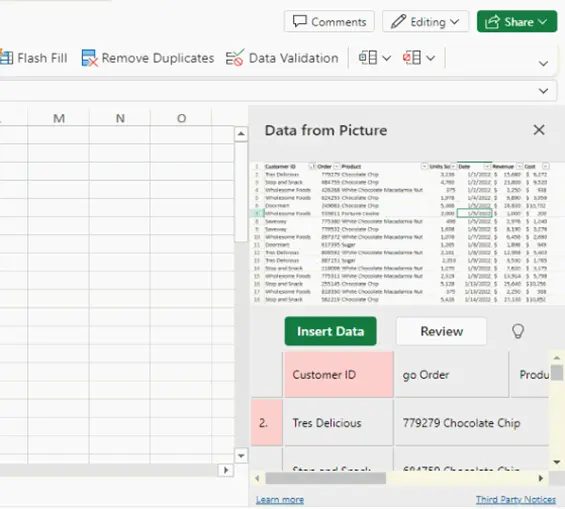
Step 6: Review the data for accuracy.
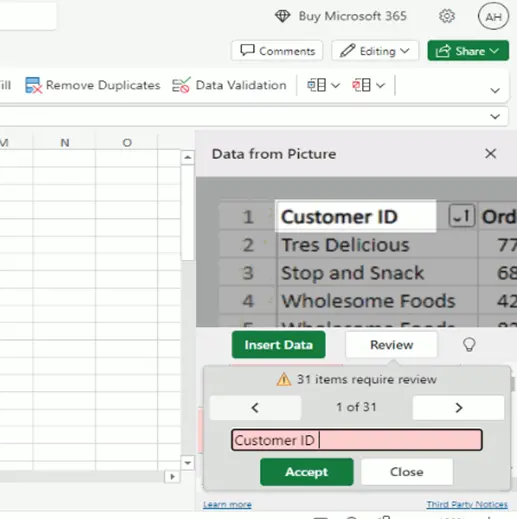
Step 7: Once reviewed, click Insert Data. The AI will import data from the picture into the Excel sheet.

Dynamic Array: AI Resizable Arrays in Excel Sheets
Dynamic Array is an AI feature in Excel that allows you to work with multiple values simultaneously in a single formula. Until now, you have used the CSE rule where the formula had to be entered in the entire range. The AI in Excel sheets brings you the Dynamic array formulas that can spill outside the cell bounds into neighboring cells.
This AI feature not only saves time but reduces the chances of error.
Following are a few functions you can use to leverage the potential of dynamic arrays.
- UNIQUE: It removes duplicates and returns unique values in the list.
- SORT: It sorts the list in increasing or decreasing order.
- FILTER: It filters the data in the list based on set criteria.
- SEQUENCE: It lets you create a list of sequential numbers.
Given below are the steps to follow while using dynamic array formulas.
Step 1: Open the Excel software.
Step 2: Insert the data on which you want to apply the dynamic array function.
Step 3: Next, Enter the formula in an empty cell. In this example, we have applied the UNIQUE formula in Cell D2.
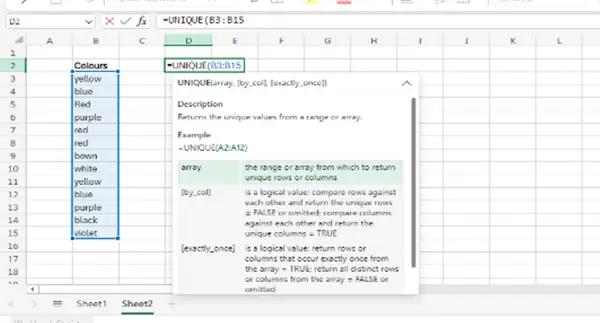
Step 4: Lastly, hit the Enter key.
Step 5: As a result, AI in Excel sheets will remove all the duplicate values (from B3:B15) and output a list with different values only. The output will be shown in the column, starting from the cell where you input the formula. D2:D9 in this example.

If any change in the source data is made, the Dynamic Array will automatically re-adjust.
AI-Powered Geography Data Type
Geographical information is essential for businesses to understand customer behavior, market shifts, etc. You often have to work with geographical data on an Excel spreadsheet. Manually searching and updating data takes time.
So, you can exploit AI in Excel sheets and save time. Microsoft Excel has a built-in geography data type that can help you retrieve geographical data and build map charts. The AI feature can give you details about zip codes, time zones, cities, countries, states, etc. of your data.
Follow the steps below to use Excel's geography data type.
Step 1: Open the MS Excel spreadsheet.
Step 2: Then, Type some geographic text into the cell. It can be a country, city, town, etc.
Step 3: Next, Select the cells containing the data.
Step 4: Now, Click on the Data tab and select Geography.
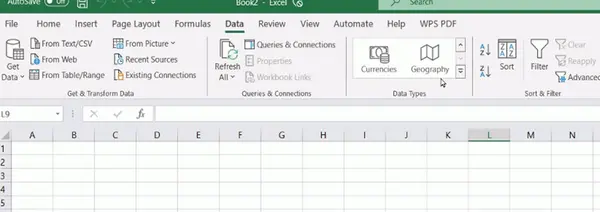
Step 5: If the text in the cell matches the online data source, the AI in Excel will convert it into a geography data type. You will see the sign before the text.
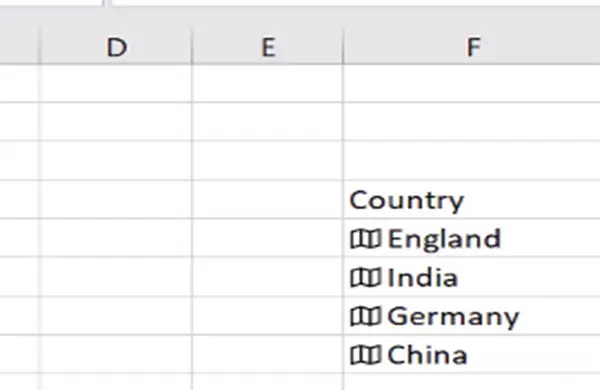
But if the text does not match the data source, you will see this sign instead.
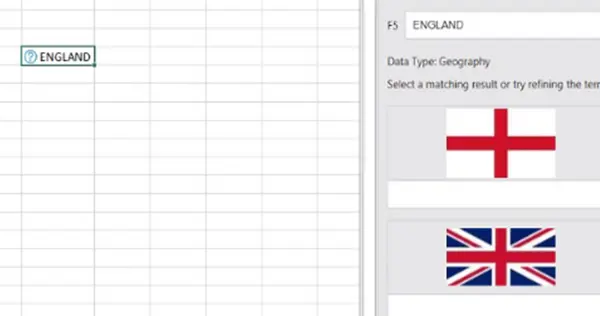
Step 6: After that, select the cell with the data type. An Insert data button will show up. Click that.
Pro Tip: If you want to simplify the data handling, insert a table.
Step 7: You will see multiple clickable fields like population, housing units, area, etc.
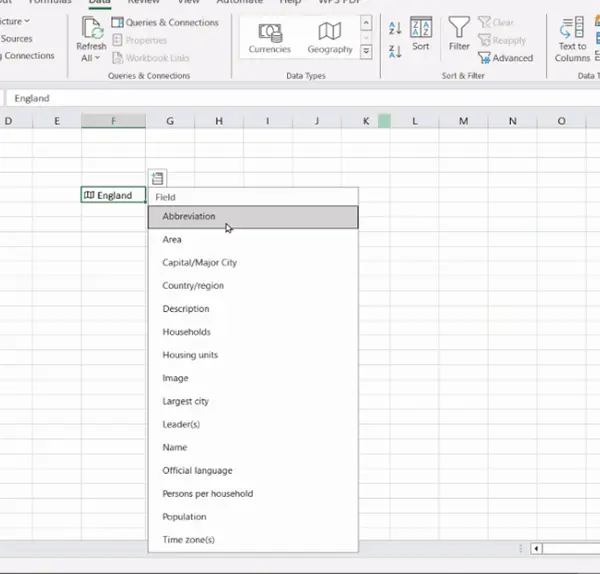
Click on your required field to extract further information.
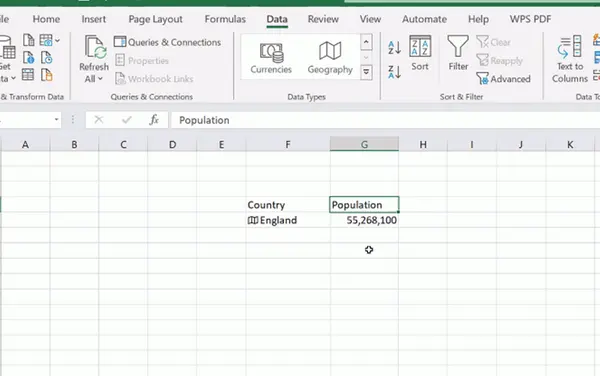
Step 8: If you want to add more fields, click the Insert Data button again.

AI-Enabled Stock Data Type
MS Excel Stock data type is another linked data type, just like the geography one. The built-in AI feature of Excel allows users to extract stock-related information. In addition to stocks, the data type also supports bonds, currencies, crypto, and mutual funds.
The steps to use the stock data type are the same as those of the geography data type.
Step 1: Open the Excel spreadsheet and type in the data. It could be a company's name or a stock symbol.
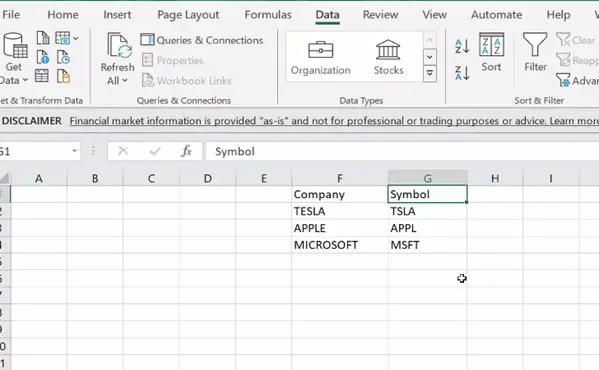
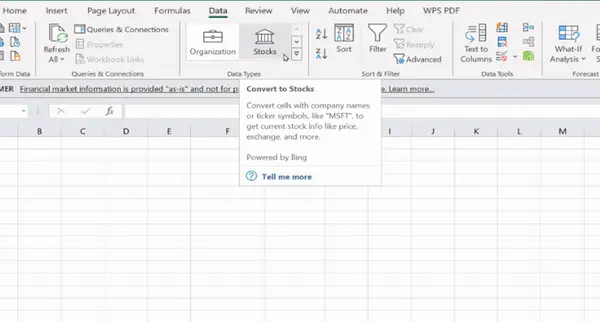
Step 2: Then, Select the cells containing the data. Now click the Stock from the data tab.
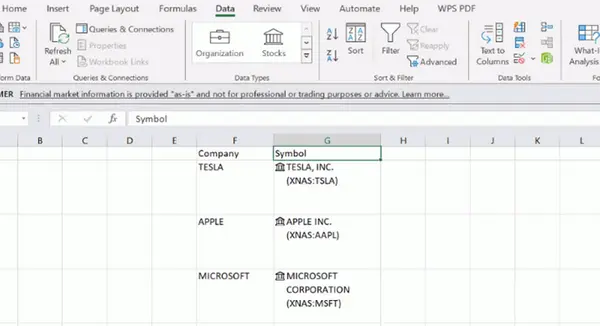
Step 3: You will see another sign before the data as it will be converted into a stock data type.
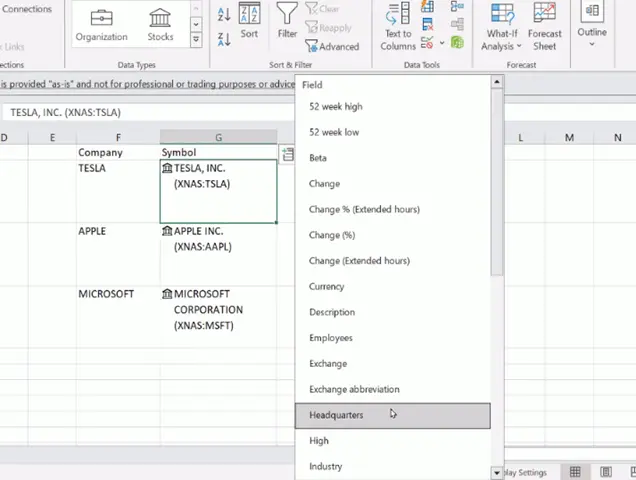
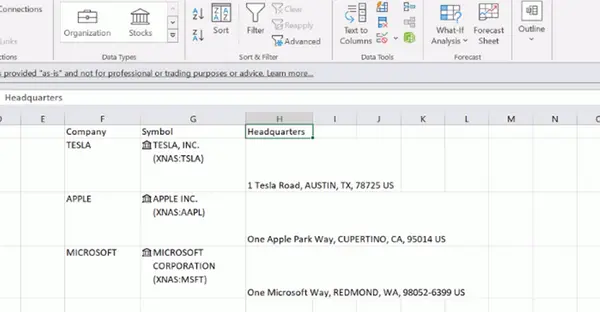
Step 4: Select the cell again and click the Insert Data button. A list containing the options related to the stock market will pop up. Click on your required field. For example, clicking on the headquarters field will give you further information about the field.
Step 5: As a result, AI in Excel will add a column with the information next to your data.
Flash Fill: AI Pattern Recognition Feature in Excel
Flash Fill is an AI-driven tool in Excel sheets for data organization. It senses a pattern in your entered data and then fills it automatically. In the same way as AutoFill, Flash Fill automates the data entry and saves you time.
You have to type in a few examples of the output you want. AI in Excel sheets will recognize the pattern and fill up the remaining cells. You can use the flash fill feature for
- Extracting a particular piece of information from the given data.
- Changing the format of the dates, etc.
Follow the steps below to harness the power of Flash Fill in Excel
Step 1: Open the Excel Spreadsheet.
Step 2: Then, Input the data you want to work on.
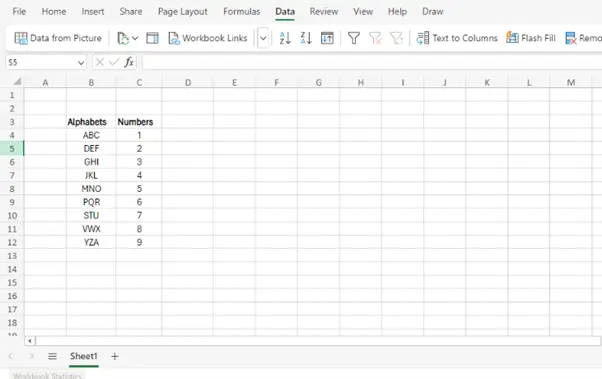
Step 3: Next, add a new column. After that, type the desired output in the added column. In the given example, we have combined the values in both columns. So, we entered the Alphabet and number in cell D4.
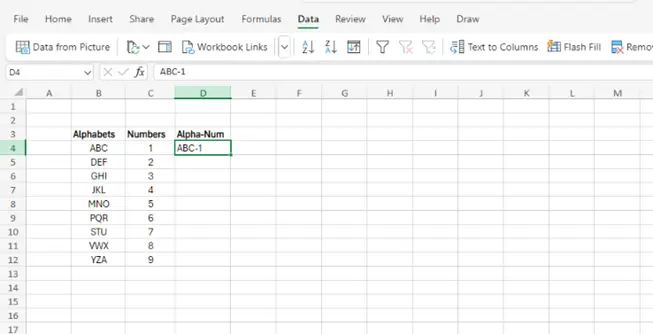
Step 4: Click on the Flash Fill icon in the Data tab.

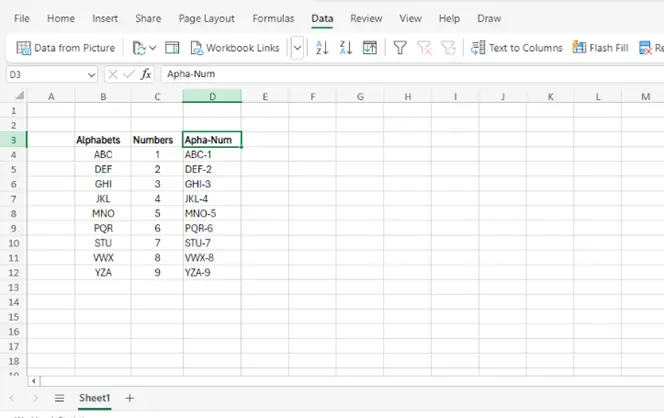
Step 5: The AI in Excel sheets will identify the pattern and automatically fill the data in the rest of the cells.
External AI Add-Ins for Excel
In addition to the built-in AI tool we have discussed, Excel also has External plug-ins. These third-party AI tools can integrate with Excel to further enhance its efficiency.
A few of such tools are
AI Excel Bot
AI Excel Bot helps you generate complex formulas in response to the text prompts. The ChatGPT-powered AI bot can also understand VBA and tricky formulas.
Lumelixr.ai
It is another AI tool that generates Excel formulas and saves you the hassle of Googling them.
XLSTAT
XLSTAT is an AI add-in tool for statistical analysis of Data in Excel sheets.
Benefits of Using AI in Excel Sheets
The employment of AI in Excel sheets has many benefits. Following are some of these
- Time-Saving
- Cost Saving
- Reduced Human-error
- Improved Efficiency
- Task Automation
- Predictive Data Analysis
- Intelligent Suggestions
- Enhanced Data Visualization
- Improved Decision making
Wrap UP
In conclusion, AI has made Excel spreadsheets much easier to use. From automated data entry to predictive data assessment and generating formulas, AI in Excel sheets has enhanced its productivity manifolds.
But as we know, good and evil go hand in hand. So, the integration of AI in Excel has its limitations. AI can assist Excel in manipulating tricky data but can never fully replace it. So, instead of relying on the power of AI entirely, combine your genius with it and see the magic.
Handling complex data will feel like a breeze.


